This example of the Arduino IDE Serial Plotter is using it as a virtual six channel analog osciloscope, to show the voltage input change at the analog inputs of the Arduino. It can be used as an aid to check inputs to a sketch using LDR’s as input sensors for a project.
Light Dependant Resistor (LDR) Demonstration
This is a screen shot of the 6 analog input serial plotter showing the expanded Y or vertical scale of the analog inputs at ambient or quiescent conditions. The 6 inputs are different amplitudes because of the difference in values of the LDR’s coating due to manufacturing tolerances.
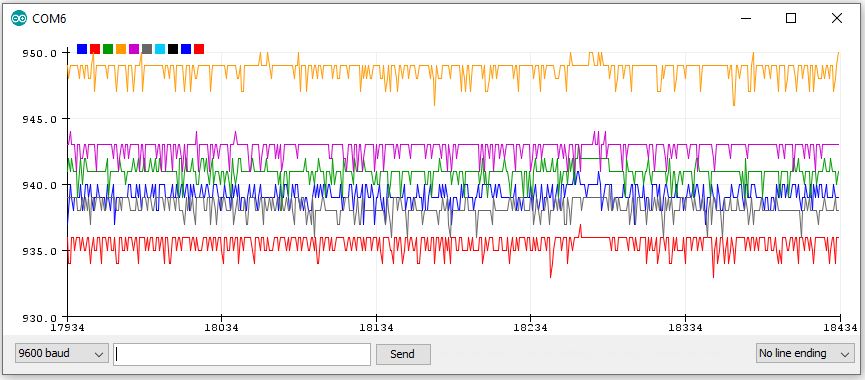
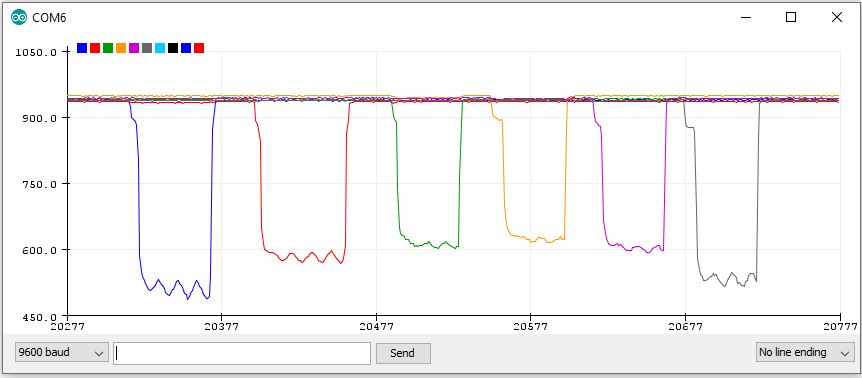
Each of the LDR’s are covered over in sequence, from A0 to A5 to show their individual characteristcs. The Y or vertical axis is changed automatically by the Serial Plotter program to show maximum resolution. The X or horizontal axis timing has 500 points, The time between each point is the time between two consecutive Serial.println() function calls. This time is usually equal to the time of loop() function.
Code – copy and paste into IDE then Save As 6InputSerialPlotter
/*6InputSerialPlotter
* Arduin0 – Serial Plotter 4 is Created by ArduinoGetStarted.com
* modified by Don Allen to show 6 analog input traces or plots 15 June 2020.
*
* The example code for the 4 input analog plotter is in the public domain
* I have added analog inputs 5 and 6.Note that the Serial plotter program added two extra coloured traces.
*
* Use your breadboard to connect one leg of your LDR to +5V, the other leg of the LDR to one leg of a 47K resistor, the other leg of the 47K resistor to Ground,
* use a jumper wire to connect the junction of the LDR and 47K resistor to each of the analog inputs A0 – A5
* Spread your LDR’s as far apart as you can, so covering one LDR does not affest the other 5 LDR’s.
* Uploard this sketch to your Arduino, run the Serial Plotter Tools > Serial Potter or Control+Shift+L and you can see the LDR values change as you cover them up.
* With no LDR inputs covered, the six traces are spaced by their noise values, when you conver an LDR the Y axis scale changes and you see a large excursion and the other 5 traces compress.
*
* X-axis: represent the time. It has 500 points. The time between each point is the time between two consecutive Serial.println() function calls. This time is usually equal to the time of loop() function.
* Y-axis: represents the values received from Arduino. The Y-axis automatically adjusts itself as the value increases or decreases.
*
* Tutorial page: https://arduinogetstarted.com/tutorials/arduino-serial-plotter
*/
void setup() {
Serial.begin(9600);
}
void loop() {
int y1 = analogRead(A0);
int y2 = analogRead(A1);
int y3 = analogRead(A2);
int y4 = analogRead(A3);
int y5 = analogRead(A4);
int y6 = analogRead(A5);
Serial.print(y1);
Serial.print(” “); // a space ‘ ‘ or tab ‘\t’ character is printed between the two values.
Serial.print(y2);
Serial.print(” “); // a space ‘ ‘ or tab ‘\t’ character is printed between the two values.
Serial.print(y3);
Serial.print(” “); // a space ‘ ‘ or tab ‘\t’ character is printed between the two values.
Serial.print(y4);
Serial.print(” “); // a space ‘ ‘ or tab ‘\t’ character is printed between the two values.
Serial.print(y5);
Serial.print(” “); // a space ‘ ‘ or tab ‘\t’ character is printed between the two values.
Serial.println(y6); // the last value is followed by a carriage return and a newline characters.
delay(100);
}
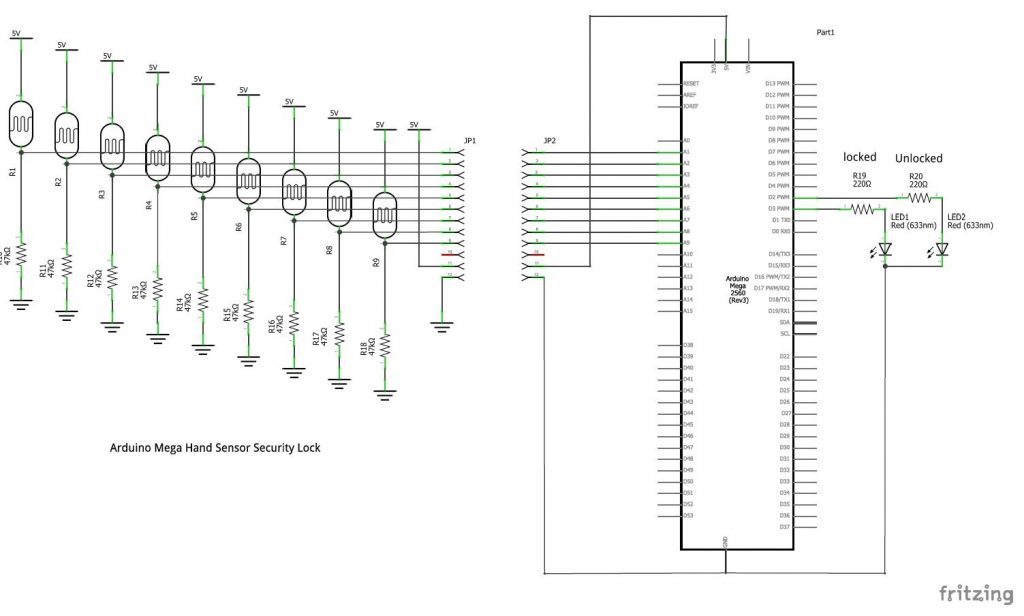
A Hand Sensor Security Lock is an example of using nine analogue inputs to use for a combination lock.
A Mega has been used as a Uno only has six analogue inputs.
The schematic has been drawn using fritzing, then the stripboard layout is done in the Breadboard window, with the breadboard being deleted and replaced with a stripboard.
This page updated 10 September 2020.